Market Outlook
April 18, 2017
Market Cues
Domestic Indices
Chg (%)
(Pts)
(Close)
Indian markets are likely to open flat tracking the SGX Nifty & global cues.
BSE Sensex
(0.2)
(48)
29,414
The US markets bounced back on Monday to close near session highs, halting three
Nifty
(0.1)
(12)
9,139
straight sessions of declines for major benchmarks. The Dow Jones Industrial
Mid Cap
0.3
36
14,387
Average rose 0.9%, to close at 20,637. The Nasdaq Composite Index gained 0.9%,
Small Cap
0.5
73
14,954
to close at 5,857. Monday’s climb comes as corporate earnings get under way and
as geopolitical tensions, notably those between the U.S. and North Korea have
Bankex
(0.1)
(23)
24,708
heightened worries about aggressions escalating into a nuclear confrontation.
European and the UK markets were closed for the Easter holiday on Monday.
Global Indices
Chg (%)
(Pts)
(Close)
Dow Jones
0.9
184
20,637
BSE Sensex closed lower 0.16%, to 29,414, while the Nifty 50 fell 0.13%, to 9,139
as investors waited for positive corporate results after a disappointing start to the
Nasdaq
0.9
52
5,857
earnings season last week when Infosys issued lower-than-expected revenue
FTSE
(0.3)
(21)
7,328
guidance.
Nikkei
0.1
20
18,355
Hang Seng
(0.2)
(52)
24,262
News Analysis
Shanghai Com
(0.7)
(24)
3,222
TCS 4Q result Preview
Detailed analysis on Pg2
Advances / Declines
BSE
NSE
Investor’s Ready Reckoner
Advances
1,499
842
Key Domestic & Global Indicators
Declines
1,442
864
Stock Watch: Latest investment recommendations on 150+ stocks
Unchanged
167
90
Refer Pg6 onwards
Volumes (` Cr)
Top Picks
CMP
Target
Upside
Company
Sector
Rating
BSE
3,479
(`)
(`)
(%)
NSE
22,544
Blue Star
Capital Goods
Accumulate
687
760
10.6
Dewan Housing Fin. Financials
Buy
399
460
15.2
Mahindra Lifespace
Real Estate
Buy
411
522
26.9
Net Inflows (` Cr)
Net
Mtd
Ytd
Navkar Corporation Others
Buy
202
265
31.2
FII
(496)
(492)
43,728
KEI Industries
Capital Goods
Accumulate
195
207
6.2
MFs
435
750
10,188
More Top Picks on Pg4
Key Upcoming Events
Top Gainers
Price (`)
Chg (%)
Previous
Consensus
Date
Region
Event Description
Ibrealest
148
40.0
Reading
Expectations
Apr 18, 2017 China
Real GDP (YoY)
6.90
6.80
Rtnpower
9
16.7
Apr 18, 2017 US
Building permits
1216.00
1250.00
Fortis
203
9.3
Apr 18, 2017 US
Initial Jobless claims
234.00
240.00
Hdil
93
8.8
Apr 19, 2017 US
Industrial Production
0.11
0.40
Polaris
214
8.3
Apr 20, 2017 Euro Zone Euro-Zone CPI (YoY)
1.50
1.50
Apr 20, 2017 Euro Zone Euro-Zone Consumer Confidence
-5.00
-4.80
More Events on Pg5
Top Losers
Price (`)
Chg (%)
Den
90
(6.4)
Rcom
34
(4.5)
Dcbbank
173
(3.6)
Pfc
157
(3.5)
Cumminsind
960
(3.4)
As on April 17, 2017
Market Outlook
April 18, 2017
Result Preview
TCS (CMP: `2,321 / TP: `2,700 / Upside: 16.3%)
TCS is slated to announce its 4QFY2017 results today. We expect the company to
post revenue of US$4,470mn with 1.9% qoq growth, mostly volume led. In rupee
terms, revenues are expected to grow by 0.9% qoq to `29,996cr, lead by rupee
appreciation. EBITDA margin is expected to almost remain flat at 27.7%, EBIT, on
other hand, is expected to come in at 26.0%, a 2bps qoq dip. PAT is expected to
be at `6,855cr, up 1.1% qoq sequentially. The main factor to watch out is the
FY2018 outlook. We maintain our buy rating with target price of `2,700.
Y/E
Sales OPM
PAT EPS ROE P/E P/BV EV/EBITDA EV/Sales
March
(` cr)
(%)
(` cr)
(`)
(%)
(x)
(x)
(x)
(x)
FY2017E
1,19,025
27.6
25,685 131.2
32.4
17.7
5.7
12.4
3.4
FY2018E
1,33,308
27.6
28,483 145.5
33.1
15.9
5.3
10.9
3.0
Economic and Political News
Wholesale inflation falls to 5.7% in March from 6.5% in February
Farm loan waivers to be 2% of GDP before 2019 polls
India seeks to end urea import in 5 years
Govt plans stake sale worth `34,000 cr in IOC, SAIL, five other PSUs
Economy to grow 7.2% in FY18; GST to have positive impact: World Bank
Corporate News
Modi hints at rules for generic drugs' prescription
Daiichi Sankyo objects to Religare stake sale
2017 will prove to be a good year for Indian hotels, budget hospitality
Credit boom could drive $44 billion Indian bank deal
NTPC power generation cost drops to below `2/unit
Apollo Tyres plans to increase market share in Europe to 3.5% from 2.5%
Market Outlook
April 18, 2017
Quarterly Bloomberg Brokers Consensus Estimate
Tata Consultancy Services Ltd Consol - Apr 18, 2017
Particulars ( ` cr)
4QFY17E
4QFY16
y-o-y (%)
3QFY17 q-o-q (%)
Net sales
29,856
28,449
4.9
29,735
0.4
EBITDA
8,227
7,907
4.1
8,228
(0.0)
EBITDA margin (%)
27.6
27.8
27.7
Net profit
6,646
6,413
3.6
6,778
(1.9)
IndusInd Bank Ltd - Apr 19, 2017
Particulars ( ` cr)
4QFY17E
4QFY16
y-o-y (%)
3QFY17 q-o-q (%)
Net profit
784
620
26.4
751
4.5
Yes Bank Ltd - Apr 19, 2017
Particulars ( ` cr)
4QFY17E
4QFY16
y-o-y (%)
3QFY17 q-o-q (%)
Net profit
897
702
27.7
883
1.6
Hindustan Zinc Ltd - Apr 20, 2017
Particulars ( ` cr)
4QFY17E
4QFY16
y-o-y (%)
3QFY17 q-o-q (%)
Net sales
6,106
3,070
98.9
4,944
23.5
EBITDA
3,522
1,308
169.3
2,783
26.5
EBITDA margin (%)
57.7
42.6
56.3
Net profit
2,903
2,149
35.1
2,320
25.1
Market Outlook
April 18, 2017
Top Picks ★★★★★
Market Cap
CMP
Target
Upside
Company
Rationale
(` Cr)
(`)
(`)
(%)
Strong growth in domestic business due to its leadership in
Alkem Laboratories
25,732
2,152
2,257
4.9
acute therapeutic segment. Alkem expects to launch more
products in USA, which bodes for its international business.
We expect the company would report strong profitability
Asian Granito
1,120
372
405
8.8
owing to better product mix, higher B2C sales and
amalgamation synergy..
Among the top 4 players in the consumer durables segment.
Bajaj Electricals
3,590
354
395
11.4
Improved profitability backed by turn around in E&P segment.
Strong order book lends earnings visibility.
Favourable outlook for the AC industry to augur well for
Cooling products business which is out pacing the market
Blue Star
6,567
687
760
10.6
growth. EMPPAC division's profitability to improve once
operating environment turns around..
With a focus on the low and medium income (LMI) consumer
Dewan Housing Finance
12,501
399
460
15.2
segment, the company has increased its presence in tier-II &
III cities where the growth opportunity is immense.
Strong loan growth backed by diversified loan portfolio and
Equitas Holdings
5,599
166
235
41.8
adequate CAR. ROE & ROA likely to remain decent as risk of
dilution remains low. Attractive valuations considering growth.
Economic recovery to have favourable impact on advertising
& circulation revenue growth. Further, the acquisition of a
Jagran Prakashan
6,453
197
225
14.0
radio business (Radio City) would also boost the company's
revenue growth.
High order book execution in EPC segment, rising B2C sales
KEI Industries
1,516
195
207
6.2
and higher exports to boost the revenues and profitability
Speedier execution and speedier sales, strong revenue visibilty
Mahindra Lifespace
1,688
411
522
26.9
in short-to-long run, attractive valuations
Higher growth in domestic branded sales and healthy export
Mirza International
1,091
91
107
18.0
to boost the profitability.
Massive capacity expansion along with rail advantage at ICD
Navkar Corporation
2,880
202
265
31.2
as well CFS augurs well for the company
Strong brands and distribution network would boost growth
Siyaram Silk Mills
1,596
1,702
1,872
10.0
going ahead. Stock currently trades at an inexpensive
valuation.
Market leadership in Hindi news genre and no. 2 viewership
ranking in English news genre, exit from the radio business,
TV Today Network
1,640
275
344
25.1
and anticipated growth in ad spends by corporates to benefit
the stock.
Source: Company, Angel Research
Market Outlook
April 18, 2017
Key Upcoming Events
Result Calendar
Date
Company
April 18, 2017
TCS
April 19, 2017
IndusInd Bank, Yes Bank
April 20, 2017
Mindtree, Infotech Enterprises, Hind. Zinc
April 21, 2017
FAG Bearings, ACC
Source: Bloomberg, Angel Research
Global economic events release calendar
Bloomberg Data
Date
Time
Country
Event Description
Unit
Period
Last Reported
Estimated
Apr 18, 2017
7:30 AM China
Real GDP (YoY)
% Change
1Q
6.90
6.80
6:00 PM US
Building permits
Thousands
Mar
1216.00
1250.00
6:00 PM US
Initial Jobless claims
Thousands
Apr 15
234.00
240.00
Apr 19, 2017
6:45 PM US
Industrial Production
%
Mar
0.11
0.40
Apr 20, 2017
2:30 PM Euro Zone Euro-Zone CPI (YoY)
%
Mar F
1.50
1.50
7:30 PM Euro Zone Euro-Zone Consumer Confidence
Value
Apr A
-5.00
-4.80
Apr 21, 2017
1:00 PM Germany PMI Services
Value
Apr P
55.60
55.50
1:00 PM Germany PMI Manufacturing
Value
Apr P
58.30
58.00
7:30 PM US
Existing home sales
Million
Mar
5.48
5.60
Apr 25, 2017
7:30 PM US
Consumer Confidence
S.A./ 1985=100
Apr
125.60
124.00
7:30 PM US
New home sales
Thousands
Mar
592.00
590.00
Apr 27, 2017
5:15 PM Euro Zone ECB announces interest rates
%
Apr 27
0.00
Apr 28, 2017
6:00 PM US
GDP Qoq (Annualised)
% Change
1Q A
2.10
1.50
2:00 PM UK
GDP (YoY)
% Change
1Q A
1.90
April 30, 2017
2:00 PM UK
PMI Manufacturing
Value
Apr
54.20
Source: Bloomberg, Angel Research
Market Outlook
April 18, 2017
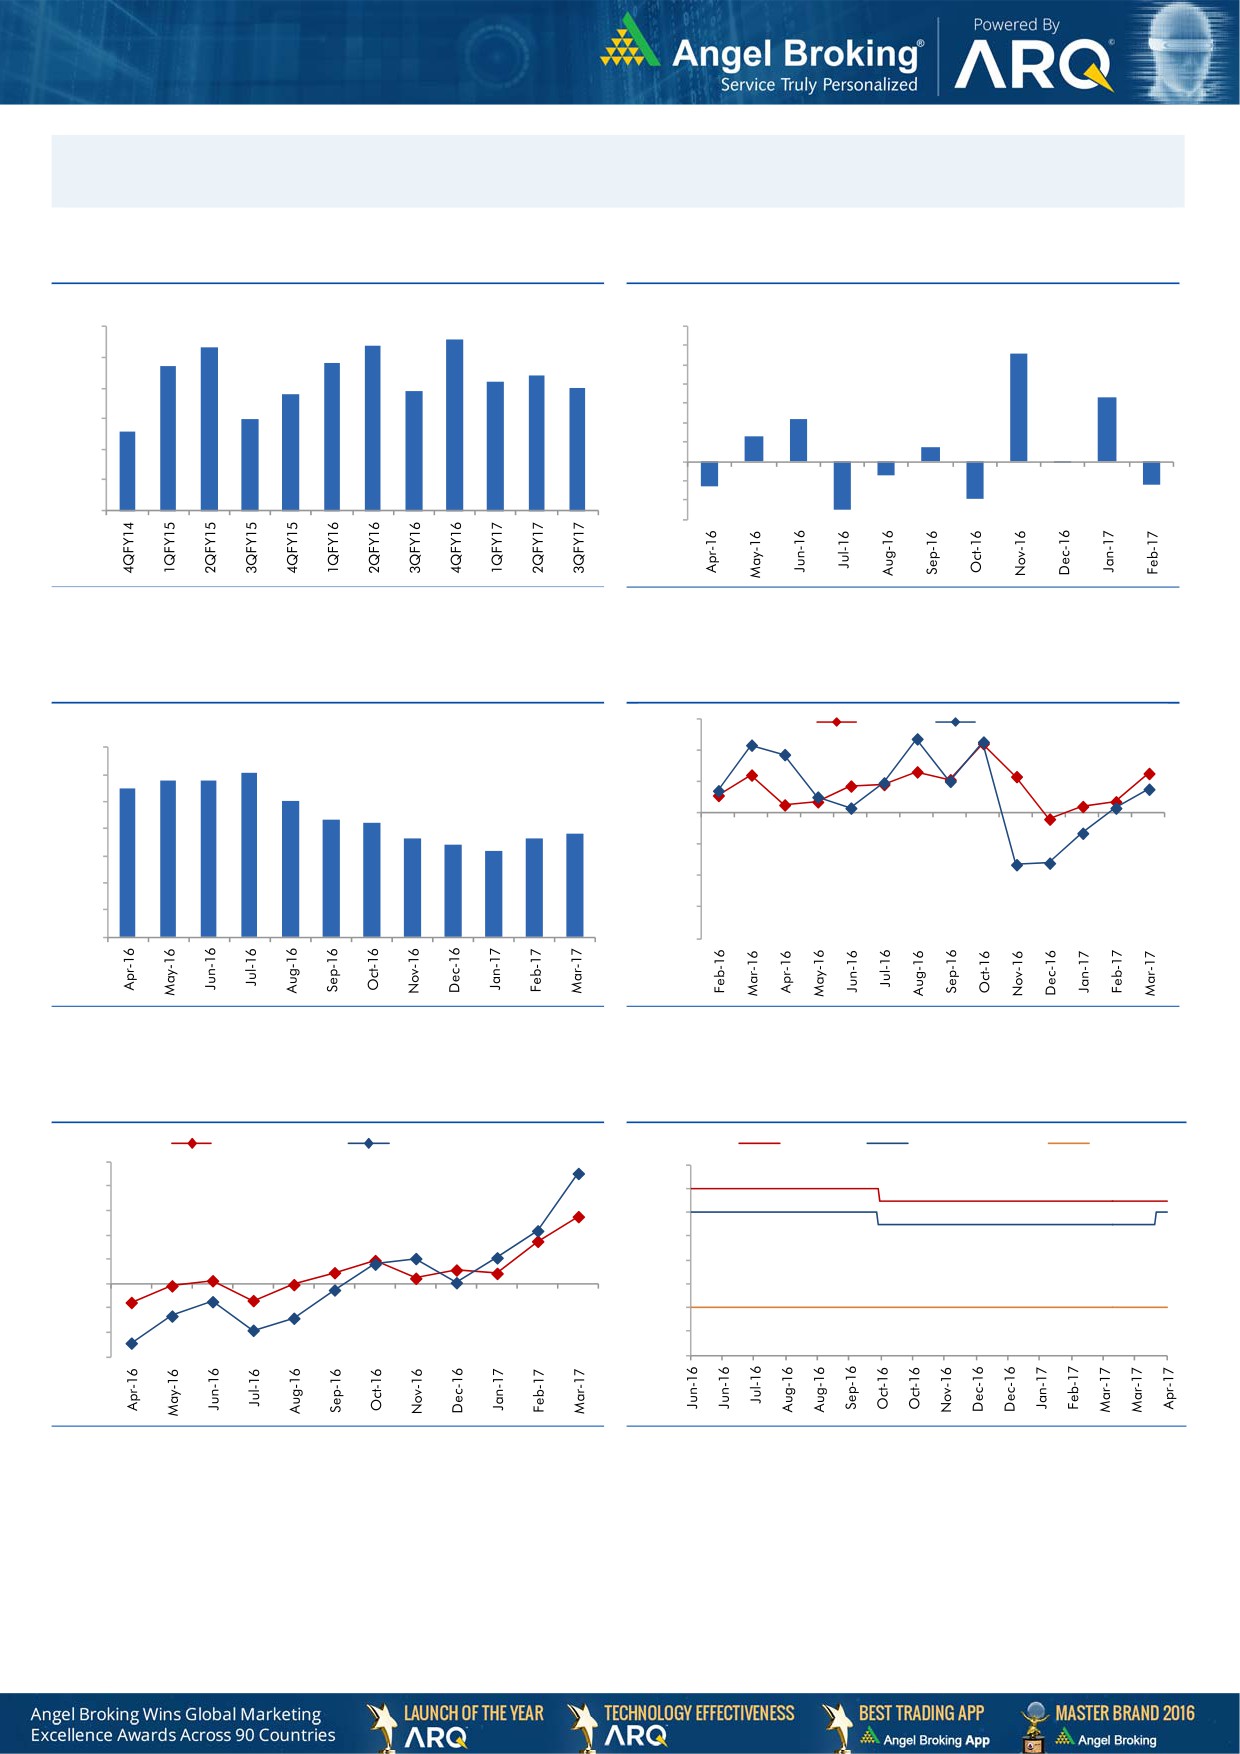
Macro watch
Exhibit 1: Quarterly GDP trends
Exhibit 2: IIP trends
(%)
(%)
8.6
9.0
8.3
8.4
7.0
5.6
7.7
7.8
6.0
8.0
7.4
7.2
5.0
6.9
7.0
6.8
4.0
3.3
7.0
6.0
3.0
2.2
6.0
5.6
1.3
2.0
0.7
1.0
5.0
-
4.0
(1.0)
(0.1)
(0.7)
(2.0)
(1.3)
(1.2)
3.0
(3.0)
(1.9)
(2.5)
Source: CSO, Angel Research
Source: MOSPI, Angel Research
Exhibit 3: Monthly CPI inflation trends
Exhibit 4: Manufacturing and services PMI
56.0
Mfg. PMI
Services PMI
(%)
7.0
54.0
6.1
5.8
5.8
6.0
5.5
5.1
52.0
5.0
4.3
4.2
3.8
50.0
3.6
3.7
4.0
3.4
3.2
48.0
3.0
46.0
2.0
1.0
44.0
-
42.0
Source: MOSPI, Angel Research
Source: Market, Angel Research; Note: Level above 50 indicates expansion
Exhibit 5: Exports and imports growth trends
Exhibit 6: Key policy rates
(%)
Exports yoy growth
Imports yoy growth
(%)
Repo rate
Reverse Repo rate
CRR
50.0
7.00
40.0
6.50
30.0
6.00
20.0
5.50
10.0
5.00
0.0
4.50
(10.0)
4.00
(20.0)
3.50
(30.0)
3.00
Source: Bloomberg, Angel Research
Source: RBI, Angel Research
Market Outlook
April 18, 2017
Global watch
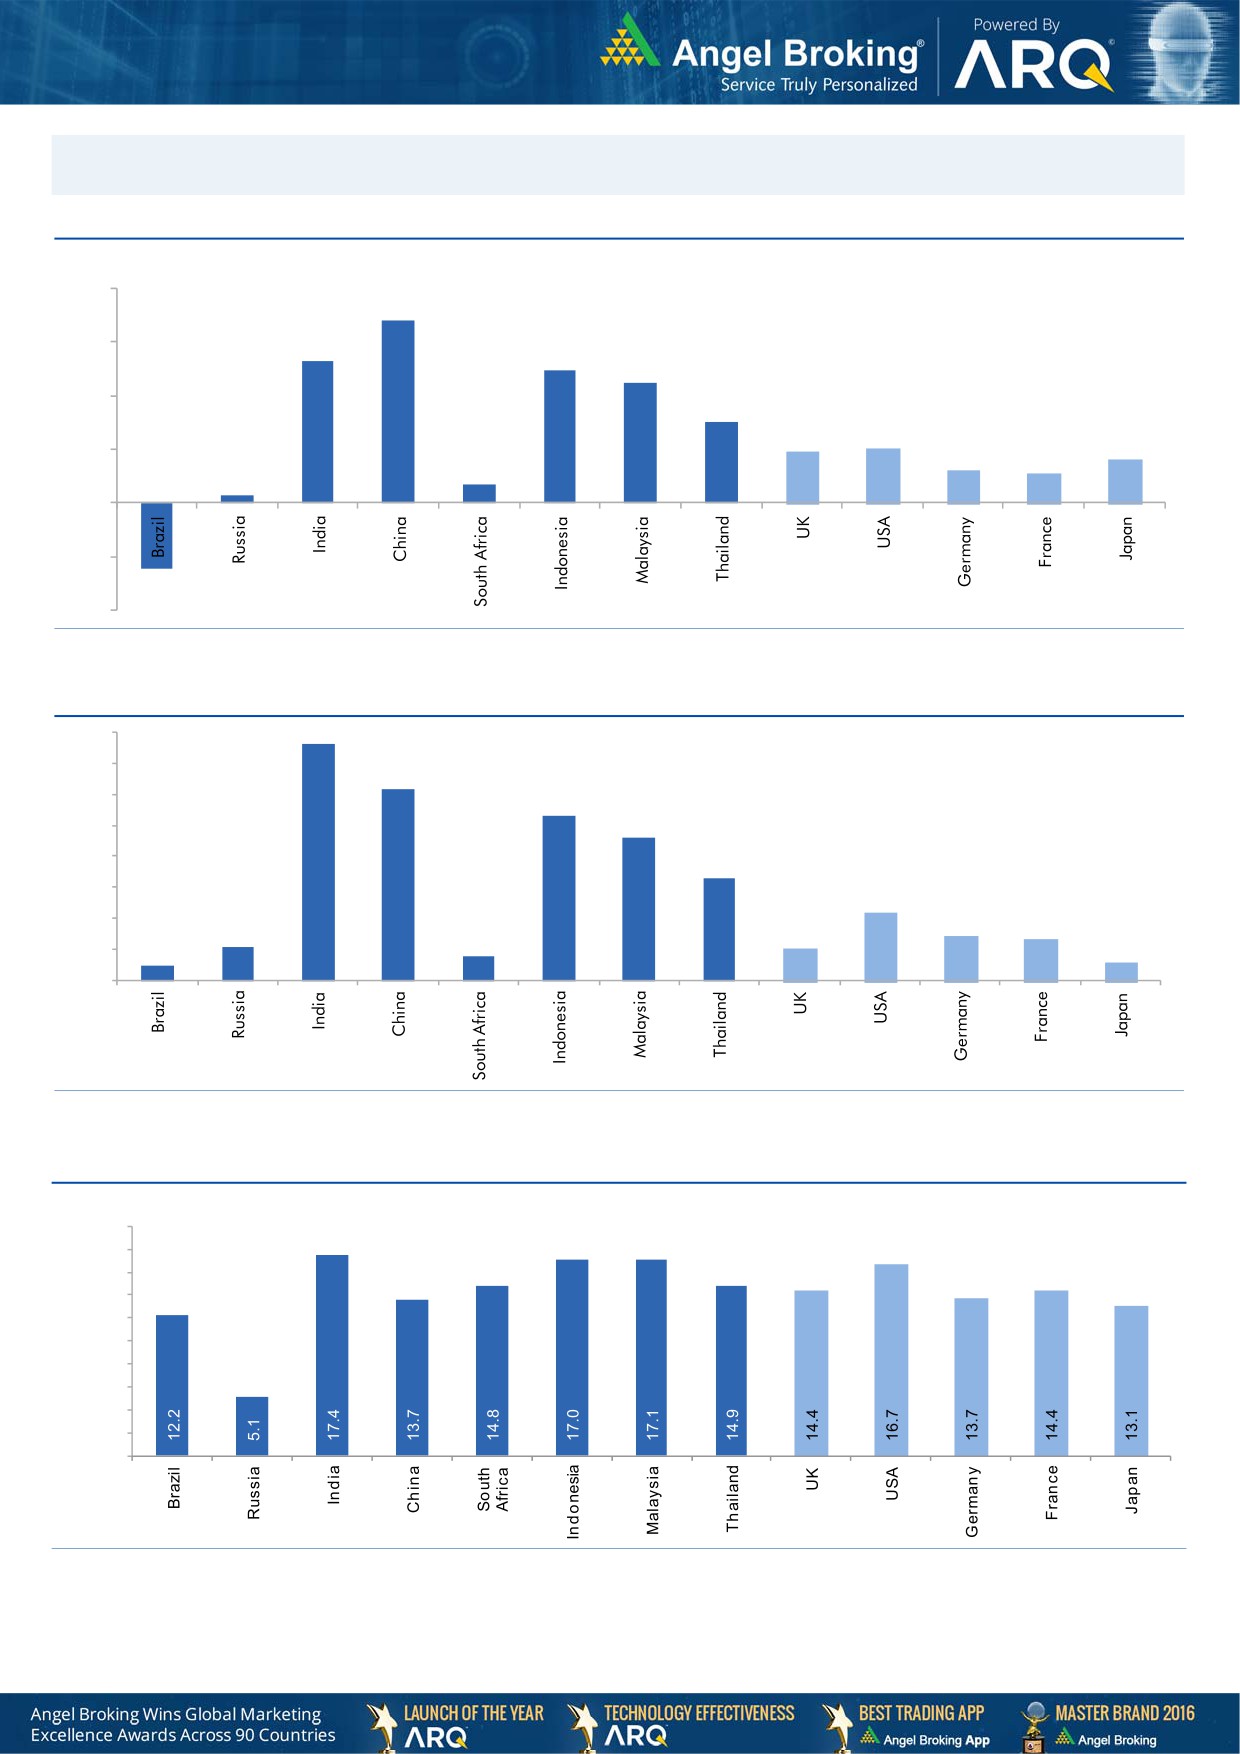
Exhibit 1: Latest quarterly GDP Growth (%, yoy) across select developing and developed countries
(%)
8.0
6.8
6.0
5.3
4.9
0.7
4.5
4.0
3.0
1.9
2.0
2.0
0.3
1.6
1.2
1.1
-
(2.0)
(2.5)
(4.0)
Source: Bloomberg, Angel Research
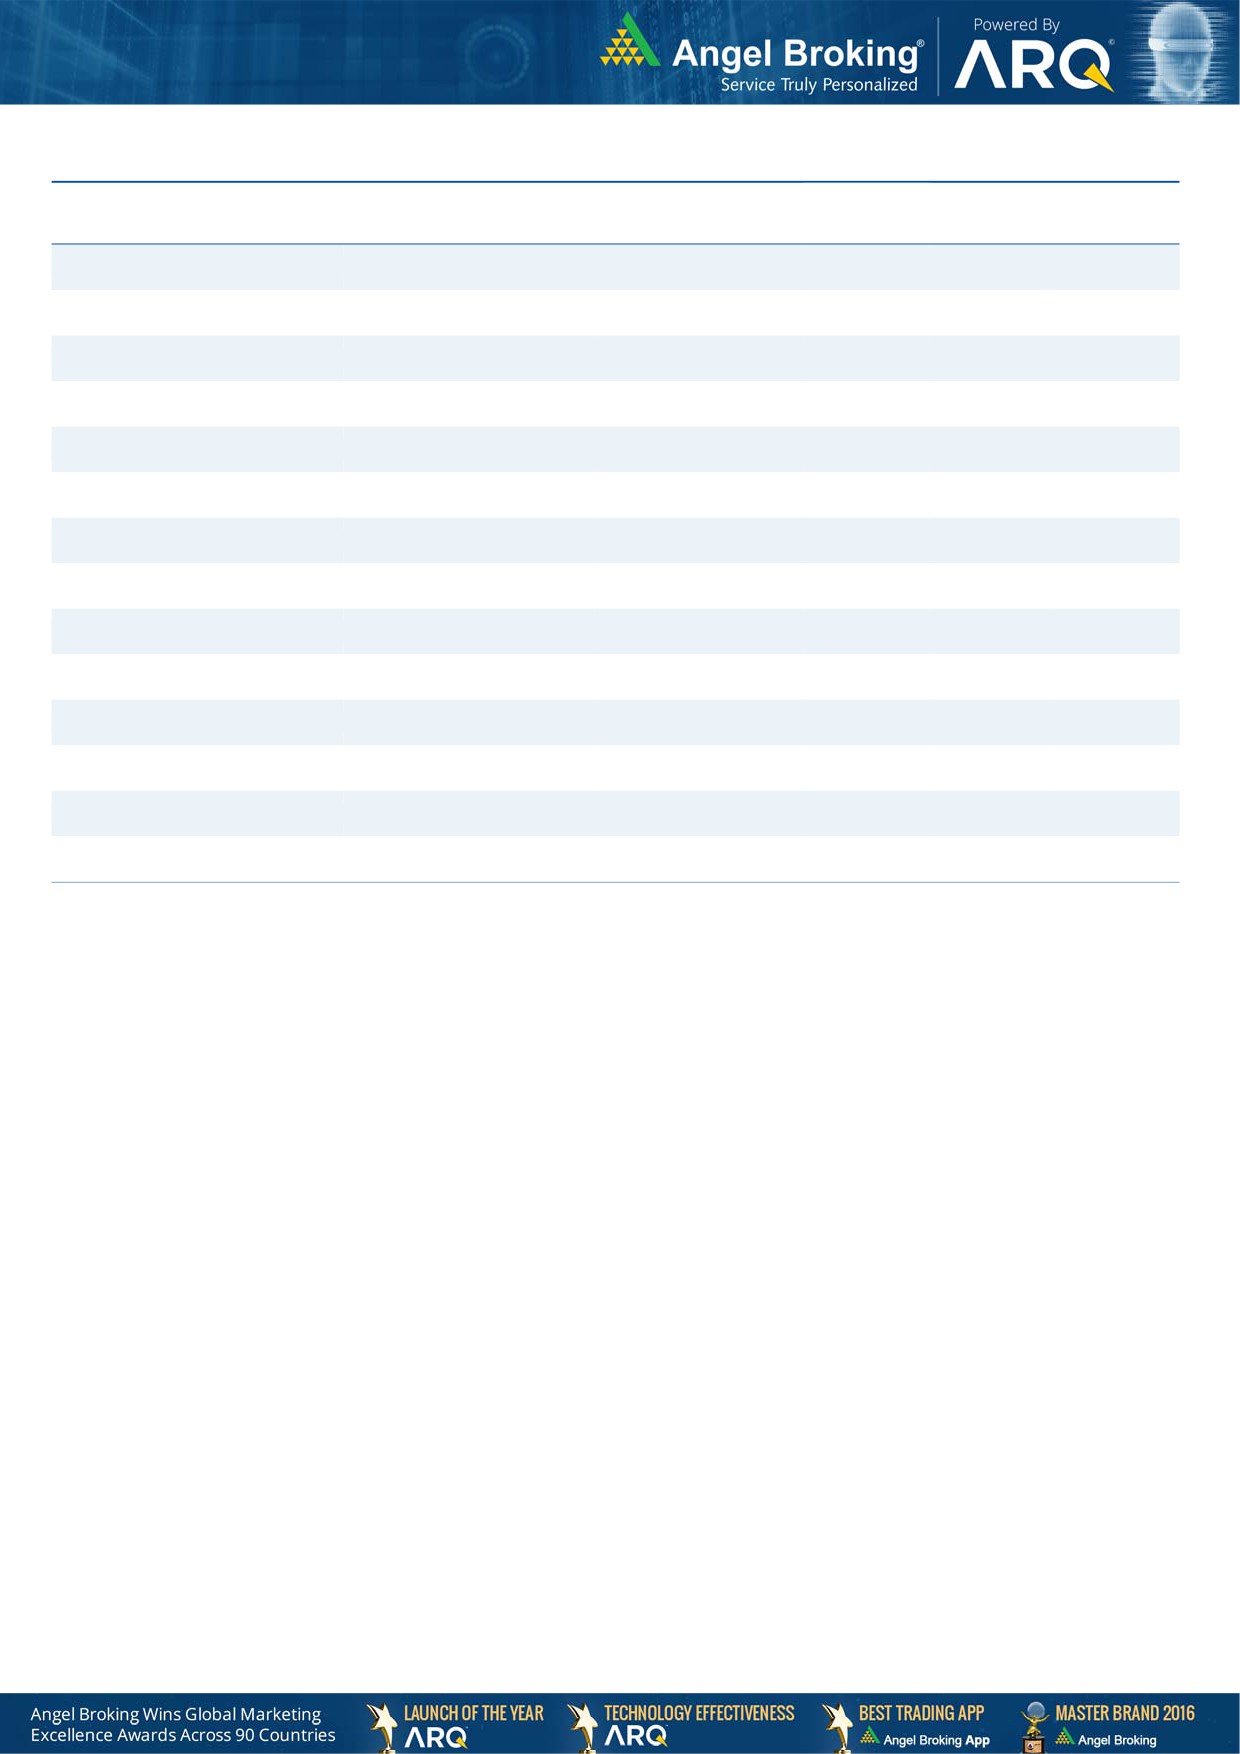
Exhibit 2: 2016 GDP Growth projection by IMF (%, yoy) across select developing and developed countries
(%)
7.6
7.0
6.2
6.0
5.3
4.6
5.0
4.0
3.3
3.0
2.2
2.0
1.1
1.4
1.3
0.5
1.1
0.8
1.0
0.6
-
Source: IMF, Angel Research
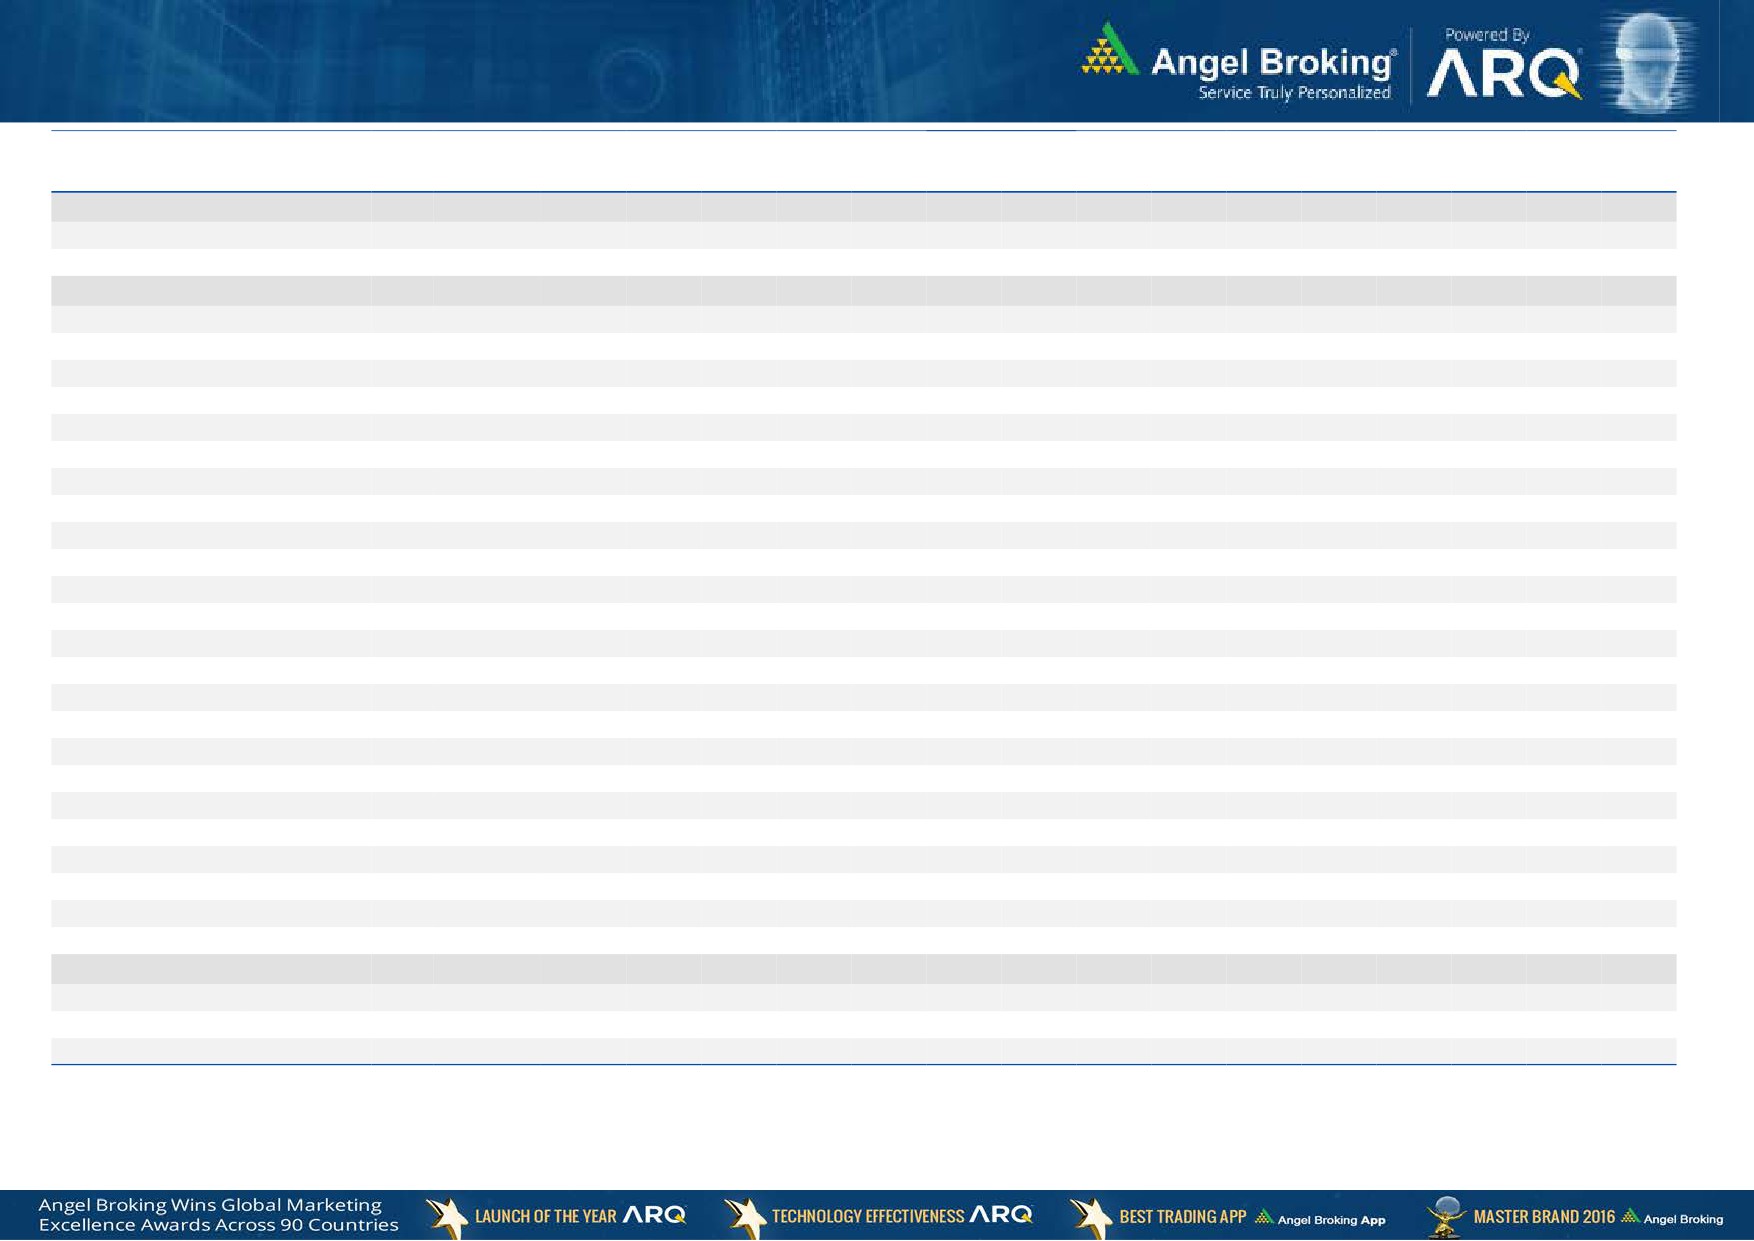
Exhibit 3: One year forward P-E ratio across select developing and developed countries
(x)
20.0
18.0
16.0
14.0
12.0
10.0
8.0
6.0
4.0
2.0
-
Source: IMF, Angel Research
Market Outlook
April 18, 2017
Exhibit 4: Relative performance of indices across globe
Returns (%)
Country
Name of index
Closing price
1M
3M
1YR
Brazil
Bovespa
64,335
(2.9)
1.1
18.2
Russia
Micex
1,943
(5.0)
(12.8)
(0.8)
India
Nifty
9,139
0.6
10.3
21.0
China
Shanghai Composite
3,222
(0.5)
2.2
5.5
South Africa
Top 40
46,644
4.0
2.0
0.1
Mexico
Mexbol
49,012
3.9
6.7
8.7
Indonesia
LQ45
917
1.8
3.6
9.2
Malaysia
KLCI
1,734
(0.2)
3.3
1.1
Thailand
SET 50
1,000
2.5
1.8
10.4
USA
Dow Jones
20,637
(1.8)
2.5
14.3
UK
FTSE
7,328
(0.4)
(0.1)
14.4
Japan
Nikkei
18,355
(6.2)
(3.9)
16.5
Germany
DAX
12,109
1.0
4.1
16.7
France
CAC
5,071
1.9
3.0
11.9
Source: Bloomberg, Angel Research
Stock Watch
April 18, 2017
Company Name
Reco
CMP
Target
Mkt Cap
Sales ( Čcr )
OPM(%)
EPS (Č)
PER(x)
P/BV(x)
RoE(%)
EV/Sales(x)
(Č)
Price ( Č)
( Č cr )
FY17E
FY18E
FY17E
FY18E
FY17E
FY18E
FY17E
FY18E
FY17E
FY18E
FY17E
FY18E
FY17E
FY18E
Agri / Agri Chemical
Rallis
Neutral
250
-
4,853
1,937
2,164
13.3
14.3
9.0
11.0
27.7
22.7
4.8
4.2
18.4
19.8
2.6
2.2
United Phosphorus
Neutral
735
-
37,292
15,176
17,604
18.5
18.5
37.4
44.6
19.7
16.5
3.9
3.2
21.4
21.2
2.6
2.2
Auto & Auto Ancillary
Amara Raja Batteries
Buy
856
1,009
14,622
5,305
6,100
16.0
16.3
28.4
34.0
30.1
25.2
5.8
4.9
19.3
19.3
2.8
2.4
Apollo Tyres
Neutral
230
-
11,682
12,877
14,504
14.3
13.9
21.4
23.0
10.7
10.0
1.7
1.5
16.4
15.2
1.1
1.0
Ashok Leyland
Buy
83
111
23,550
20,021
21,915
11.6
11.9
4.5
5.3
18.4
15.6
3.7
3.3
20.6
21.5
1.1
1.0
Bajaj Auto
Neutral
2,851
-
82,484
25,093
27,891
19.5
19.2
143.9
162.5
19.8
17.5
5.6
4.8
30.3
29.4
3.0
2.6
Bharat Forge
Neutral
1,059
-
24,660
7,726
8,713
20.5
21.2
35.3
42.7
30.0
24.8
5.5
5.0
18.9
20.1
3.3
2.8
Ceat
Neutral
1,450
-
5,866
7,524
8,624
13.0
12.7
131.1
144.3
11.1
10.1
2.0
1.7
19.8
18.6
0.9
0.7
Eicher Motors
Neutral
26,125
-
71,088
16,583
20,447
17.5
18.0
598.0
745.2
43.7
35.1
14.9
11.4
41.2
38.3
4.1
3.3
Exide Industries
Neutral
230
-
19,584
7,439
8,307
15.0
15.0
8.1
9.3
28.4
24.8
4.0
3.6
14.3
16.7
2.2
2.0
Gabriel India
Neutral
124
-
1,783
1,544
1,715
9.0
9.3
5.4
6.3
23.0
19.7
4.3
3.8
18.9
19.5
1.1
1.0
Hero Motocorp
Accumulate
3,230
3,446
64,501
28,083
30,096
15.3
15.7
171.8
187.0
18.8
17.3
6.6
5.5
30.1
27.9
2.1
1.9
Indag Rubber
Neutral
205
-
538
286
326
19.8
16.8
11.7
13.3
17.5
15.4
3.0
2.8
17.8
17.1
1.5
1.4
Jamna Auto Industries
Neutral
230
-
1,835
1,486
1,620
9.8
9.9
15.0
17.2
15.4
13.4
3.4
2.8
21.8
21.3
1.3
1.2
JK Tyres
Neutral
145
-
3,299
7,455
8,056
15.0
15.0
21.8
24.5
6.7
5.9
1.4
1.1
22.8
21.3
0.6
0.5
L G Balakrishnan & Bros Neutral
631
-
990
1,302
1,432
11.6
11.9
43.7
53.0
14.4
11.9
2.0
1.9
13.8
14.2
0.9
0.8
Mahindra and Mahindra Neutral
1,269
-
78,835
46,534
53,077
11.6
11.7
67.3
78.1
18.9
16.3
3.1
2.7
15.4
15.8
1.7
1.4
Maruti
Accumulate
6,120
6,560
184,875
67,822
83,288
16.0
16.4
253.8
312.4
24.1
19.6
5.5
4.5
23.0
22.9
2.4
1.9
Minda Industries
Neutral
441
-
3,498
2,728
3,042
9.0
9.1
68.2
86.2
6.5
5.1
1.5
1.2
23.8
24.3
1.3
1.2
Motherson Sumi
Neutral
373
-
52,284
45,896
53,687
7.8
8.3
13.0
16.1
28.6
23.1
9.2
7.3
34.7
35.4
1.2
1.0
Rane Brake Lining
Neutral
1,004
-
795
511
562
11.3
11.5
28.1
30.9
35.7
32.5
5.5
5.0
15.3
15.0
1.7
1.6
Setco Automotive
Neutral
40
-
538
741
837
13.0
13.0
15.2
17.0
2.7
2.4
0.4
0.4
15.8
16.3
1.1
1.0
Subros
Neutral
228
-
1,365
1,488
1,681
11.7
11.9
6.4
7.2
35.6
31.7
3.8
3.4
10.8
11.4
1.2
1.0
Swaraj Engines
Neutral
1,466
-
1,821
660
810
15.2
16.4
54.5
72.8
26.9
20.1
8.4
7.6
31.5
39.2
2.6
2.1
Tata Motors
Neutral
450
-
129,786
300,209
338,549
8.9
8.4
42.7
54.3
10.5
8.3
1.7
1.4
15.6
17.2
0.5
0.5
TVS Motor
Neutral
472
-
22,422
13,390
15,948
6.9
7.1
12.8
16.5
37.0
28.5
9.2
7.3
26.3
27.2
1.7
1.4
Capital Goods
ACE
Neutral
65
-
641
709
814
4.1
4.6
1.4
2.1
46.3
30.8
1.9
1.8
4.4
6.0
1.1
0.9
BEML
Neutral
1,380
-
5,745
3,451
4,055
6.3
9.2
31.4
57.9
43.9
23.8
2.6
2.4
6.3
10.9
1.8
1.5
BGR Energy
Neutral
168
-
1,209
16,567
33,848
6.0
5.6
7.8
5.9
21.5
28.4
1.2
1.2
4.7
4.2
0.2
0.1
Stock Watch
April 18, 2017
Company Name
Reco
CMP
Target
Mkt Cap
Sales ( Čcr )
OPM(%)
EPS (Č)
PER(x)
P/BV(x)
RoE(%)
EV/Sales(x)
(Č)
Price ( Č)
( Č cr )
FY17E
FY18E
FY17E
FY18E
FY17E
FY18E
FY17E
FY18E
FY17E
FY18E
FY17E
FY18E
FY17E
FY18E
Capital Goods
Bharat Electronics
Neutral
171
-
38,217
8,137
9,169
16.8
17.2
58.7
62.5
2.9
2.7
0.5
0.4
44.6
46.3
3.7
3.3
BHEL
Neutral
173
-
42,282
28,797
34,742
-
2.8
2.3
6.9
75.1
25.0
1.3
1.2
1.3
4.8
1.1
0.8
Blue Star
Accumulate
687
760
6,567
4,283
5,077
5.9
7.3
14.9
22.1
46.2
31.1
9.0
7.6
20.4
26.4
1.6
1.3
CG Power and Industrial
Neutral
80
-
4,989
5,777
6,120
5.9
7.0
3.3
4.5
24.1
17.7
1.1
1.0
4.4
5.9
0.8
0.7
Solutions
Greaves Cotton
Neutral
167
-
4,089
1,755
1,881
16.8
16.9
7.8
8.5
21.5
19.7
4.3
4.0
20.6
20.9
2.0
1.8
Inox Wind
Neutral
189
-
4,185
5,605
6,267
15.7
16.4
24.8
30.0
7.6
6.3
2.1
1.6
25.9
24.4
0.8
0.7
KEC International
Neutral
213
-
5,472
9,294
10,186
7.9
8.1
9.9
11.9
21.5
17.9
3.2
2.7
15.6
16.3
0.8
0.7
KEI Industries
Accumulate
195
207
1,516
2,682
3,058
10.4
10.0
11.7
12.8
16.6
15.2
3.3
2.8
20.1
18.2
0.8
0.7
Thermax
Neutral
992
-
11,825
5,421
5,940
7.3
7.3
25.7
30.2
38.6
32.9
4.7
4.3
12.2
13.1
2.1
1.9
VATech Wabag
Neutral
656
-
3,579
3,136
3,845
8.9
9.1
26.0
35.9
25.2
18.3
3.2
2.7
13.4
15.9
1.0
0.8
Voltas
Neutral
408
-
13,505
6,511
7,514
7.9
8.7
12.9
16.3
31.6
25.0
5.7
5.0
16.7
18.5
1.8
1.6
Cement
ACC
Neutral
1,500
-
28,162
11,225
13,172
13.2
16.9
44.5
75.5
33.7
19.9
3.2
2.9
11.2
14.2
2.5
2.1
Ambuja Cements
Neutral
247
-
49,075
9,350
10,979
18.2
22.5
5.8
9.5
42.6
26.0
3.6
3.2
10.2
12.5
5.3
4.5
India Cements
Neutral
163
-
5,019
4,364
4,997
18.5
19.2
7.9
11.3
20.7
14.5
1.5
1.5
8.0
8.5
1.9
1.7
J K Lakshmi Cement
Neutral
455
-
5,351
2,913
3,412
14.5
19.5
7.5
22.5
60.6
20.2
3.7
3.1
12.5
18.0
2.4
2.0
JK Cement
Neutral
920
-
6,433
4,398
5,173
15.5
17.5
31.2
55.5
29.5
16.6
3.5
3.1
12.0
15.5
2.0
1.7
Orient Cement
Neutral
150
-
3,077
2,114
2,558
18.5
20.5
8.1
11.3
18.5
13.3
2.7
2.3
9.0
14.0
2.1
1.6
UltraTech Cement
Neutral
3,997
-
109,708
25,768
30,385
21.0
23.5
111.0
160.0
36.0
25.0
4.6
4.0
13.5
15.8
4.4
3.6
Construction
Engineers India
Neutral
161
-
10,843
1,725
1,935
16.0
19.1
11.4
13.9
14.1
11.6
2.0
1.9
13.4
15.3
5.2
4.7
Gujarat Pipavav Port
Neutral
163
-
7,866
705
788
52.2
51.7
5.0
5.6
32.5
29.1
3.2
2.9
11.2
11.2
10.8
9.2
ITNL
Neutral
112
-
3,686
8,946
10,017
31.0
31.6
8.1
9.1
13.8
12.3
0.5
0.5
4.2
5.0
3.7
3.5
KNR Constructions
Neutral
201
-
2,820
1,385
1,673
14.7
14.0
41.2
48.5
4.9
4.1
0.9
0.8
14.9
15.2
2.1
1.7
Larsen & Toubro
Neutral
1,680
-
156,827
111,017
124,908
11.0
11.0
61.1
66.7
27.5
25.2
3.3
3.1
13.1
12.9
2.4
2.3
MEP Infra
Neutral
66
-
1,073
1,877
1,943
30.6
29.8
3.0
4.2
22.0
15.7
10.7
7.2
0.6
0.6
2.0
1.8
Nagarjuna Const.
Neutral
94
-
5,226
8,842
9,775
9.1
8.8
5.3
6.4
17.7
14.7
1.4
1.3
8.2
9.1
0.8
0.7
NBCC
Neutral
181
-
16,259
7,428
9,549
7.9
8.6
8.2
11.0
22.0
16.4
1.1
0.9
28.2
28.7
1.9
1.4
PNC Infratech
Neutral
140
-
3,586
2,350
2,904
13.1
13.2
9.0
8.8
15.5
15.9
0.6
0.5
15.9
13.9
1.6
1.3
Power Mech Projects
Neutral
548
-
806
1,801
2,219
12.7
14.6
72.1
113.9
7.6
4.8
1.4
1.2
16.8
11.9
0.5
0.3
Sadbhav Engineering
Neutral
328
-
5,623
3,598
4,140
10.3
10.6
9.0
11.9
36.4
27.5
3.8
3.3
9.9
11.9
1.9
1.6
Stock Watch
April 18, 2017
Company Name
Reco
CMP
Target
Mkt Cap
Sales ( Čcr )
OPM(%)
EPS (Č)
PER(x)
P/BV(x)
RoE(%)
EV/Sales(x)
(Č)
Price ( Č)
( Č cr )
FY17E
FY18E
FY17E
FY18E
FY17E
FY18E
FY17E
FY18E
FY17E
FY18E
FY17E
FY18E
FY17E
FY18E
Construction
Simplex Infra
Neutral
381
-
1,886
6,829
7,954
10.5
10.5
31.4
37.4
12.1
10.2
1.3
1.2
9.9
13.4
0.7
0.6
SIPL
Neutral
102
-
3,600
1,036
1,252
65.5
66.2
(8.4)
(5.6)
3.8
4.4
(22.8)
(15.9)
11.7
9.7
Financials
Axis Bank
Buy
502
580
120,339
46,932
53,575
3.5
3.4
32.4
44.6
15.5
11.3
2.0
1.7
13.6
16.5
-
-
Bank of Baroda
Neutral
176
-
40,530
19,980
23,178
1.8
1.8
11.5
17.3
15.3
10.2
1.8
1.4
8.3
10.1
-
-
Can Fin Homes
Neutral
2,507
-
6,674
420
526
3.5
3.5
86.5
107.8
29.0
23.3
6.2
5.1
23.6
24.1
-
-
Canara Bank
Neutral
311
-
16,860
15,225
16,836
1.8
1.8
14.5
28.0
21.4
11.1
1.5
1.2
5.8
8.5
-
-
Cholamandalam Inv. &
Buy
1,049
1,230
16,398
2,012
2,317
6.3
6.3
42.7
53.6
24.6
19.6
3.9
3.3
16.9
18.3
-
-
Fin. Co.
Dewan Housing Finance Buy
399
460
12,501
2,225
2,688
2.9
2.9
29.7
34.6
13.4
11.5
2.2
1.4
16.1
14.8
-
-
Equitas Holdings
Buy
166
235
5,599
939
1,281
11.7
11.5
5.8
8.2
28.6
20.2
2.5
2.2
10.9
11.5
-
-
Federal Bank
Neutral
93
-
15,938
8,259
8,995
3.0
3.0
4.3
5.6
21.5
16.5
1.8
1.7
8.5
10.1
-
-
HDFC
Neutral
1,478
-
234,797
11,475
13,450
3.4
3.4
45.3
52.5
32.6
28.2
6.3
5.6
20.2
20.5
-
-
HDFC Bank
Neutral
1,436
-
367,994
46,097
55,433
4.5
4.5
58.4
68.0
24.6
21.1
4.3
3.6
18.8
18.6
-
-
ICICI Bank
Accumulate
282
315
164,094
42,800
44,686
3.1
3.3
18.0
21.9
15.7
12.9
2.1
2.0
11.1
12.3
-
-
Karur Vysya Bank
Buy
118
140
7,107
5,640
6,030
3.3
3.2
8.9
10.0
13.2
11.8
1.4
1.3
11.2
11.4
-
-
Lakshmi Vilas Bank
Neutral
172
-
3,294
3,339
3,799
2.7
2.8
11.0
14.0
15.6
12.3
1.6
1.5
11.2
12.7
-
-
LIC Housing Finance
Neutral
637
-
32,124
3,712
4,293
2.6
2.5
39.0
46.0
16.3
13.8
3.1
2.6
19.9
20.1
-
-
Punjab Natl.Bank
Neutral
159
-
33,803
23,532
23,595
2.3
2.4
6.8
12.6
23.4
12.6
3.6
2.6
3.3
6.5
-
-
RBL Bank
Neutral
541
-
19,988
1,783
2,309
2.6
2.6
12.7
16.4
42.6
33.0
4.6
4.1
12.8
13.3
-
-
Repco Home Finance
Accumulate
745
825
4,659
388
457
4.5
4.2
30.0
38.0
24.8
19.6
4.1
3.5
18.0
19.2
-
-
South Ind.Bank
Neutral
23
-
4,056
6,435
7,578
2.5
2.5
2.7
3.1
8.3
7.3
1.1
0.9
10.1
11.2
-
-
St Bk of India
Neutral
290
-
234,902
88,650
98,335
2.6
2.6
13.5
18.8
21.5
15.4
2.0
1.8
7.0
8.5
-
-
Union Bank
Neutral
154
-
10,576
13,450
14,925
2.3
2.3
25.5
34.5
6.0
4.5
0.9
0.8
7.5
10.2
-
-
Yes Bank
Neutral
1,611
-
73,538
8,978
11,281
3.3
3.4
74.0
90.0
21.8
17.9
4.1
3.5
17.0
17.2
-
-
FMCG
Akzo Nobel India
Neutral
1,927
-
9,242
2,955
3,309
13.3
13.7
57.2
69.3
33.7
27.8
11.0
9.3
32.7
33.3
2.9
2.6
Asian Paints
Neutral
1,059
-
101,550
17,128
18,978
16.8
16.4
19.1
20.7
55.4
51.1
19.3
18.2
34.8
35.5
5.8
5.3
Britannia
Accumulate
3,378
3,626
40,538
9,594
11,011
14.6
14.9
80.3
94.0
42.1
35.9
17.3
13.4
41.2
-
4.1
3.5
Colgate
Neutral
1,003
-
27,287
4,605
5,149
23.4
23.4
23.8
26.9
42.2
37.3
23.3
18.2
64.8
66.8
5.9
5.2
Dabur India
Neutral
292
-
51,480
8,315
9,405
19.8
20.7
8.1
9.2
36.1
31.8
10.0
8.3
31.6
31.0
5.8
5.1
GlaxoSmith Con*
Neutral
5,195
-
21,849
4,350
4,823
21.2
21.4
179.2
196.5
29.0
26.5
7.7
6.5
27.1
26.8
4.4
3.9
Stock Watch
April 18, 2017
Company Name
Reco
CMP
Target
Mkt Cap
Sales ( Čcr )
OPM(%)
EPS (Č)
PER(x)
P/BV(x)
RoE(%)
EV/Sales(x)
(Č)
Price ( Č)
( Č cr )
FY17E FY18E
FY17E
FY18E
FY17E
FY18E
FY17E
FY18E
FY17E
FY18E
FY17E
FY18E
FY17E
FY18E
FMCG
Godrej Consumer
Neutral
1,676
-
57,069
10,235
11,428
18.4
18.6
41.1
44.2
40.8
37.9
9.0
7.6
24.9
24.8
5.7
5.0
HUL
Neutral
913
-
197,681
35,252
38,495
17.8
17.8
20.7
22.4
44.2
40.8
42.3
36.3
95.6
88.9
5.4
5.0
ITC
Neutral
279
-
338,912
40,059
44,439
38.3
39.2
9.0
10.1
31.1
27.5
8.7
7.6
27.8
27.5
8.0
7.2
Marico
Neutral
301
-
38,882
6,430
7,349
18.8
19.5
6.4
7.7
47.1
39.1
14.2
12.0
33.2
32.5
5.9
5.1
Nestle*
Neutral
6,317
-
60,906
10,073
11,807
20.7
21.5
124.8
154.2
50.6
41.0
20.8
18.7
34.8
36.7
5.9
5.0
Procter & Gamble
Neutral
7,425
-
24,102
2,939
3,342
23.2
23.0
146.2
163.7
50.8
45.4
12.9
10.7
25.3
23.5
7.7
6.7
Hygiene
Tata Global
Neutral
149
-
9,432
8,675
9,088
9.8
9.8
7.4
8.2
20.2
18.2
1.6
1.5
7.9
8.1
1.0
0.9
IT
HCL Tech^
Buy
812
1,000
114,584
49,242
57,168
20.5
20.5
55.7
64.1
14.6
12.7
3.0
2.3
20.3
17.9
2.2
1.8
Infosys
Buy
925
1,249
212,421
68,350
77,326
27.0
27.0
62.5
69.4
14.8
13.3
3.2
2.9
21.3
21.6
2.6
2.2
TCS
Buy
2,321
2,700
457,307
119,025
133,308
27.6
27.6
131.2
145.5
17.7
16.0
5.7
5.3
32.4
33.1
3.6
3.2
Tech Mahindra
Buy
422
600
41,092
29,673
32,937
15.5
17.0
32.8
39.9
12.9
10.6
2.5
2.2
19.6
20.7
1.1
1.0
Wipro
Buy
492
583
119,577
55,440
60,430
18.1
18.1
36.1
38.9
13.6
12.6
2.5
2.3
19.0
17.6
1.9
1.7
Media
D B Corp
Neutral
386
-
7,094
2,297
2,590
27.4
28.2
21.0
23.4
18.4
16.5
4.3
3.7
23.7
23.1
2.9
2.5
Hindustan Media
Neutral
291
-
2,139
1,016
1,138
24.3
25.2
27.3
30.1
10.7
9.7
2.0
1.8
16.2
15.8
1.4
1.2
Ventures
HT Media
Neutral
85
-
1,974
2,693
2,991
12.6
12.9
7.9
9.0
10.7
9.4
0.9
0.8
7.8
8.3
0.3
0.2
Jagran Prakashan
Accumulate
197
225
6,453
2,355
2,635
28.0
28.0
10.8
12.5
18.3
15.8
4.0
3.4
21.7
21.7
2.8
2.4
Sun TV Network
Neutral
789
-
31,105
2,850
3,265
70.1
71.0
26.2
30.4
30.1
26.0
7.7
6.8
24.3
25.6
10.5
9.0
TV Today Network
Buy
275
344
1,640
567
645
26.7
27.0
15.4
18.1
17.9
15.2
2.7
2.3
14.9
15.2
2.5
2.1
Metals & Mining
Coal India
Neutral
286
-
177,408
84,638
94,297
21.4
22.3
24.5
27.1
11.7
10.6
4.9
4.6
42.6
46.0
1.6
1.4
Hind. Zinc
Neutral
278
-
117,654
14,252
18,465
55.9
48.3
15.8
21.5
17.6
13.0
2.9
2.5
17.0
20.7
8.3
6.4
Hindalco
Neutral
182
-
40,715
107,899
112,095
7.4
8.2
9.2
13.0
19.7
14.0
1.0
0.9
4.8
6.6
0.9
0.8
JSW Steel
Neutral
194
-
46,991
53,201
58,779
16.1
16.2
130.6
153.7
1.5
1.3
0.2
0.2
14.0
14.4
1.6
1.4
NMDC
Neutral
128
-
40,482
6,643
7,284
44.4
47.7
7.1
7.7
18.0
16.6
1.6
1.5
8.8
9.2
3.9
3.5
SAIL
Neutral
61
-
25,379
47,528
53,738
(0.7)
2.1
(1.9)
2.6
23.6
0.7
0.6
(1.6)
3.9
1.4
1.3
Tata Steel
Neutral
462
-
44,875
121,374
121,856
7.2
8.4
18.6
34.3
24.8
13.5
1.6
1.4
6.1
10.1
1.0
1.0
Vedanta
Neutral
236
-
69,907
71,744
81,944
19.2
21.7
13.4
20.1
17.6
11.7
1.5
1.4
8.4
11.3
1.4
1.1
Oil & Gas
Cairn India
Neutral
288
-
54,035
9,127
10,632
4.3
20.6
8.8
11.7
32.7
24.6
1.1
1.0
3.3
4.2
7.4
6.2
GAIL
Neutral
393
-
66,485
56,220
65,198
9.3
10.1
27.1
33.3
14.5
11.8
1.3
1.2
9.3
10.7
1.4
1.2
Indian Oil Corp
Neutral
425
-
206,133
373,359
428,656
5.9
5.5
54.0
59.3
7.9
7.2
1.2
1.1
16.0
15.6
0.7
0.6
Stock Watch
April 18, 2017
Company Name
Reco
CMP
Target
Mkt Cap
Sales ( Čcr )
OPM(%)
EPS (Č)
PER(x)
P/BV(x)
RoE(%)
EV/Sales(x)
(Č)
Price ( Č)
( Č cr )
FY17E FY18E
FY17E
FY18E
FY17E
FY18E
FY17E
FY18E
FY17E
FY18E
FY17E
FY18E
FY17E
FY18E
Oil & Gas
ONGC
Neutral
183
-
234,977
137,222
152,563
15.0
21.8
19.5
24.1
9.4
7.6
0.8
0.8
8.5
10.1
2.0
1.8
Reliance Industries
Neutral
1,391
-
452,253
301,963
358,039
12.1
12.6
87.7
101.7
15.9
13.7
1.6
1.5
10.7
11.3
2.0
1.6
Pharmaceuticals
Alembic Pharma
Accumulate
610
689
11,496
3,483
4,244
20.2
21.4
24.3
33.6
25.1
18.2
5.7
4.6
25.5
25.3
3.2
2.6
Alkem Laboratories Ltd
Neutral
2,152
-
25,732
6,065
7,009
18.7
20.0
80.2
92.0
26.8
23.4
6.0
5.1
22.5
21.6
4.2
3.6
Aurobindo Pharma
Buy
653
877
38,232
15,720
18,078
23.7
23.7
41.4
47.3
15.8
13.8
4.1
3.2
29.6
26.1
2.7
2.3
Aventis*
Neutral
4,662
-
10,736
2,277
2,597
16.6
17.4
128.9
157.0
36.2
29.7
6.2
4.8
21.6
26.4
4.5
3.7
Cadila Healthcare
Neutral
452
-
46,263
10,429
12,318
17.7
21.6
13.1
19.2
34.5
23.5
7.2
5.7
22.8
27.1
4.5
3.7
Cipla
Sell
576
465
46,364
15,378
18,089
15.7
16.8
19.3
24.5
29.9
23.5
3.5
3.1
12.3
13.9
3.2
2.7
Dishman Pharma
Sell
340
143
5,479
1,718
1,890
22.7
22.8
9.5
11.3
35.7
30.0
3.5
3.1
10.1
10.9
3.7
3.2
Dr Reddy's
Neutral
2,660
-
44,075
16,043
18,119
18.0
23.0
78.6
130.9
33.9
20.3
3.3
2.9
10.1
15.2
2.5
2.4
GSK Pharma*
Neutral
2,674
-
22,647
2,800
3,290
10.2
20.6
32.2
60.3
83.0
44.3
15.4
15.2
17.2
34.5
7.9
6.7
Indoco Remedies
Neutral
238
-
2,195
1,112
1,289
16.2
18.2
11.6
16.0
20.5
14.9
3.3
2.8
17.0
20.1
2.1
1.8
Ipca labs
Neutral
611
-
7,710
3,258
3,747
12.8
15.3
12.1
19.2
50.5
31.8
3.2
2.9
6.4
9.5
2.5
2.2
Lupin
Buy
1,419
1,809
64,074
15,912
18,644
26.4
26.7
58.1
69.3
24.4
20.5
4.8
3.9
21.4
20.9
4.1
3.4
Sun Pharma
Buy
677
847
162,476
31,129
35,258
32.0
32.9
30.2
35.3
22.4
19.2
3.7
3.0
20.0
20.1
4.8
4.0
Power
NTPC
Neutral
159
-
131,227
86,605
95,545
17.5
20.8
11.8
13.4
13.5
11.9
1.4
1.3
10.5
11.1
2.9
2.9
Power Grid
Accumulate
202
223
105,521
25,315
29,193
88.2
88.7
14.2
17.2
14.3
11.8
2.2
1.9
15.2
16.1
8.8
7.9
Tata Power
Neutral
84
-
22,734
36,916
39,557
17.4
27.1
5.1
6.3
16.5
13.3
1.5
1.3
9.0
10.3
1.6
1.5
Real Estate
MLIFE
Buy
411
522
1,688
1,152
1,300
22.7
24.6
29.9
35.8
13.8
11.5
1.0
1.0
7.6
8.6
2.2
1.8
Prestige Estate
Neutral
235
-
8,803
4,707
5,105
25.2
26.0
10.3
13.0
22.8
18.1
1.8
1.7
10.3
10.2
3.0
2.7
Telecom
Bharti Airtel
Neutral
341
-
136,371
105,086
114,808
34.5
34.7
12.2
16.4
28.0
20.8
1.9
1.8
6.8
8.4
2.2
1.9
Idea Cellular
Neutral
86
-
30,898
40,133
43,731
37.2
37.1
6.4
6.5
13.4
13.2
1.1
1.0
8.2
7.6
1.8
1.5
zOthers
Abbott India
Neutral
4,726
-
10,042
3,153
3,583
14.1
14.4
152.2
182.7
31.1
25.9
152.4
130.2
25.6
26.1
2.9
2.5
Asian Granito
Accumulate
372
405
1,120
1,060
1,169
12.2
12.5
12.7
15.9
29.4
23.4
2.8
2.5
9.5
10.7
1.4
1.2
Bajaj Electricals
Accumulate
354
395
3,590
4,801
5,351
5.7
6.2
10.4
13.7
34.0
25.9
4.2
3.8
12.4
14.5
0.7
0.7
Banco Products (India)
Neutral
219
-
1,567
1,353
1,471
12.3
12.4
14.5
16.3
15.1
13.4
20.9
18.8
14.5
14.6
1.1
118.0
Coffee Day Enterprises
Neutral
234
-
4,826
2,964
3,260
20.5
21.2
4.7
8.0
-
29.3
2.7
2.5
5.5
8.5
2.0
1.8
Ltd
Competent Automobiles Neutral
227
-
140
1,137
1,256
3.1
2.7
28.0
23.6
8.1
9.6
43.7
39.5
14.3
11.5
0.1
0.1
Elecon Engineering
Neutral
62
-
701
1,482
1,660
13.7
14.5
3.9
5.8
16.0
10.8
3.8
3.5
7.8
10.9
0.8
0.7
Stock Watch
April 18, 2017
Company Name
Reco
CMP
Target
Mkt Cap
Sales ( Čcr )
OPM(%)
EPS (Č)
PER(x)
P/BV(x)
RoE(%)
EV/Sales(x)
(Č)
Price ( Č)
( Č cr )
FY17E
FY18E
FY17E
FY18E
FY17E
FY18E
FY17E
FY18E
FY17E
FY18E
FY17E
FY18E
FY17E
FY18E
zOthers
Finolex Cables
Neutral
542
-
8,282
2,883
3,115
12.0
12.1
14.2
18.6
38.1
29.1
20.3
17.7
15.8
14.6
2.6
2.3
Garware Wall Ropes
Neutral
730
-
1,598
863
928
15.1
15.2
36.4
39.4
20.1
18.5
3.6
3.1
17.5
15.9
1.8
1.6
Goodyear India*
Neutral
875
-
2,018
1,598
1,704
10.4
10.2
49.4
52.6
17.7
16.6
81.8
71.7
18.2
17.0
0.9
135.1
Hitachi
Neutral
1,814
-
4,932
2,081
2,433
8.8
8.9
33.4
39.9
54.3
45.5
43.8
36.5
22.1
21.4
2.4
2.0
HSIL
Neutral
338
-
2,446
2,384
2,515
15.8
16.3
15.3
19.4
22.1
17.4
22.0
18.9
7.8
9.3
1.2
1.1
Interglobe Aviation
Neutral
1,092
-
39,469
21,122
26,005
14.5
27.6
110.7
132.1
9.9
8.3
59.0
42.2
168.5
201.1
1.8
1.5
Jyothy Laboratories
Neutral
399
-
7,256
1,440
2,052
11.5
13.0
8.5
10.0
47.0
39.9
11.4
10.5
18.6
19.3
5.3
3.7
Kirloskar Engines India
Neutral
392
-
5,669
2,554
2,800
9.9
10.0
10.5
12.1
37.3
32.4
15.6
14.7
10.7
11.7
1.9
1.7
Ltd
Linc Pen & Plastics
Neutral
295
-
436
382
420
9.3
9.5
13.5
15.7
21.9
18.8
3.8
3.2
17.1
17.3
1.2
1.1
M M Forgings
Neutral
600
-
725
546
608
20.4
20.7
41.3
48.7
14.6
12.3
82.3
72.8
16.6
17.0
1.2
1.1
Manpasand Bever.
Neutral
712
-
4,072
836
1,087
19.6
19.4
16.9
23.8
42.1
29.9
5.1
4.4
12.0
14.8
4.6
3.5
Mirza International
Buy
91
107
1,091
963
1,069
17.2
18.0
6.1
7.5
14.8
12.1
2.3
1.9
15.0
15.7
1.3
1.2
MT Educare
Neutral
81
-
323
366
417
17.7
18.2
9.4
10.8
8.7
7.5
1.9
1.7
22.2
22.3
0.8
0.7
Narayana Hrudaya
Neutral
322
-
6,579
1,873
2,166
11.5
11.7
2.6
4.0
121.7
81.2
7.5
6.7
6.1
8.3
3.6
3.1
Navkar Corporation
Buy
202
265
2,880
369
561
42.9
42.3
6.9
11.5
29.2
17.5
2.1
1.8
7.4
10.5
8.8
5.8
Navneet Education
Neutral
164
-
3,828
1,062
1,147
24.0
24.0
6.1
6.6
26.9
24.7
5.5
4.9
20.6
19.8
3.7
3.4
Nilkamal
Neutral
1,964
-
2,931
1,995
2,165
10.7
10.4
69.8
80.6
28.1
24.4
112.2
97.5
16.6
16.5
1.5
1.3
Page Industries
Neutral
13,865
-
15,465
2,450
3,124
20.1
17.6
299.0
310.0
46.4
44.7
308.8
235.7
47.1
87.5
6.4
5.0
Parag Milk Foods
Neutral
250
-
2,102
1,919
2,231
9.3
9.6
9.5
12.9
26.5
19.3
4.1
3.4
15.5
17.5
1.2
1.1
Quick Heal
Neutral
249
-
1,747
408
495
27.3
27.0
7.7
8.8
32.2
28.3
3.0
3.0
9.3
10.6
3.4
2.8
Radico Khaitan
Buy
115
147
1,523
1,667
1,824
13.0
13.2
6.7
8.2
17.2
14.0
1.6
1.4
9.0
10.2
1.3
1.2
Relaxo Footwears
Neutral
488
-
5,863
2,085
2,469
9.2
8.2
7.6
8.0
64.6
61.4
25.0
21.4
17.9
18.8
2.9
2.5
S H Kelkar & Co.
Neutral
318
-
4,603
1,036
1,160
15.1
15.0
6.1
7.2
52.1
44.3
5.6
5.1
10.7
11.5
4.3
3.8
Siyaram Silk Mills
Accumulate
1,702
1,872
1,596
1,652
1,857
11.6
11.7
92.4
110.1
18.4
15.5
2.7
2.4
14.7
15.2
1.2
1.0
Styrolution ABS India*
Neutral
763
-
1,342
1,440
1,537
9.2
9.0
40.6
42.6
18.8
17.9
48.0
43.6
12.3
11.6
0.9
0.8
Surya Roshni
Neutral
216
-
945
3,342
3,625
7.8
7.5
17.3
19.8
12.5
10.9
23.7
19.0
10.5
10.8
0.5
0.5
Team Lease Serv.
Neutral
1,039
-
1,776
3,229
4,001
1.5
1.8
22.8
32.8
45.6
31.6
4.9
4.2
10.7
13.4
0.5
0.3
The Byke Hospitality
Neutral
209
-
837
287
384
20.5
20.5
7.6
10.7
27.5
19.5
5.7
4.6
20.7
23.5
2.9
2.2
Transport Corporation of
Neutral
233
-
1,787
2,671
2,911
8.5
8.8
13.9
15.7
16.8
14.9
2.3
2.1
13.7
13.8
0.8
0.7
India
Stock Watch
April 18, 2017
Company Name
Reco
CMP
Target Mkt Cap
Sales ( Čcr )
OPM(%)
EPS (Č)
PER(x)
P/BV(x)
RoE(%)
EV/Sales(x)
(Č)
Price ( Č)
( Č cr )
FY17E FY18E FY17E FY18E FY17E FY18E FY17E FY18E FY17E FY18E FY17E FY18E FY17E FY18E
zOthers
TVS Srichakra
Neutral
3,724
-
2,851
2,304
2,614
13.7
13.8
231.1
266.6
16.1
14.0
418.4
329.5
33.9
29.3
1.2
1.1
UFO Moviez
Neutral
449
-
1,239
619
685
33.2
33.4
30.0
34.9
15.0
12.9
2.1
1.8
13.8
13.9
1.7
1.4
Visaka Industries
Neutral
326
-
518
1,051
1,138
10.3
10.4
21.0
23.1
15.5
14.1
41.8
39.2
9.0
9.2
0.8
0.7
VRL Logistics
Neutral
332
-
3,032
1,902
2,119
16.7
16.6
14.6
16.8
22.8
19.8
5.0
4.4
21.9
22.2
1.7
1.5
Wonderla Holidays
Neutral
390
-
2,204
287
355
38.0
40.0
11.3
14.2
34.5
27.5
4.9
4.3
21.4
23.9
7.4
6.0
VIP Industries
Neutral
196
-
2,775
1,270
1,450
10.4
10.4
5.6
6.5
35.1
30.2
7.3
6.3
20.7
21.1
2.2
1.9
Navin Fluorine
Buy
3,115
3,650
3,050
789
945
21.1
22.4
120.1
143.4
25.9
21.7
4.2
3.6
17.8
18.5
3.8
3.1
Source: Company, Angel Research; Note: *December year end; #September year end; &October year end; Price as on April 17, 2017
Market Outlook
April 18, 2017
Research Team Tel: 022 - 39357800
DISCLAIMER
Angel Broking Private Limited (hereinafter referred to as “Angel”) is a registered Member of National Stock Exchange of India
Limited,Bombay Stock Exchange Limited and Metropolitan Stock Exchange Limited. It is also registered as a Depository Participant with
CDSL and Portfolio Manager with SEBI. It also has registration with AMFI as a Mutual Fund Distributor. Angel Broking Private Limited is a
registered entity with SEBI for Research Analyst in terms of SEBI (Research Analyst) Regulations, 2014 vide registration number
INH000000164. Angel or its associates has not been debarred/ suspended by SEBI or any other regulatory authority for accessing
/dealing in securities Market. Angel or its associates/analyst has not received any compensation / managed or
co-managed public offering of securities of the company covered by Analyst during the past twelve months.
This document is solely for the personal information of the recipient, and must not be singularly used as the basis of any investment
decision. Nothing in this document should be construed as investment or financial advice. Each recipient of this document should make
such investigations as they deem necessary to arrive at an independent evaluation of an investment in the securities of the companies
referred to in this document (including the merits and risks involved), and should consult their own advisors to determine the merits and
risks of such an investment.
Reports based on technical and derivative analysis center on studying charts of a stock's price movement, outstanding positions and
trading volume, as opposed to focusing on a company's fundamentals and, as such, may not match with a report on a company's
fundamentals. Investors are advised to refer the Fundamental and Technical Research Reports available on our website to evaluate the
contrary view, if any.
The information in this document has been printed on the basis of publicly available information, internal data and other reliable
sources believed to be true, but we do not represent that it is accurate or complete and it should not be relied on as such, as this
document is for general guidance only. Angel Broking Pvt. Limited or any of its affiliates/ group companies shall not be in any way
responsible for any loss or damage that may arise to any person from any inadvertent error in the information contained in this report.
Angel Broking Pvt. Limited has not independently verified all the information contained within this document. Accordingly, we cannot
testify, nor make any representation or warranty, express or implied, to the accuracy, contents or data contained within this document.
While Angel Broking Pvt. Limited endeavors to update on a reasonable basis the information discussed in this material, there may be
regulatory, compliance, or other reasons that prevent us from doing so.
This document is being supplied to you solely for your information, and its contents, information or data may not be reproduced,
redistributed or passed on, directly or indirectly.
Neither Angel Broking Pvt. Limited, nor its directors, employees or affiliates shall be liable for any loss or damage that may arise from
or in connection with the use of this information.